Table of contents
Related Articles
- Creation of Ad-hoc Reports
-
GetDBApp: Downloading the Octopus database automatically SQL (hosted customers)
- Time sheet (report) of other assignees
Introduction
Octopus offers integrated reports and statistics. This Wiki article has been designed to help you find the information.
- Access to the dashboard, statistics and reports
List of reports and statistics
Here is the list of the categories found in the module as well as reports and statistics found in each category.
In some cases, a link is accessible as there is a more in-depth description later in this article.
Requests |
|
Incident |
|
Service Request |
|
Problem |
|
Change |
|
Configurations and suppliers |
|
Satisfaction |
|
There is another report exclusively for the planned request, it can be found in the Planned Request Management module:
- Planned efforts breakdown.
Description of the reports
Activity Timesheet
The Activity Timesheet shows the efforts entered by Octopus users, within a selected period, in their activities for all request types. It allows the analysis of different aspects, such as:
- The occupancy ratio of the Octopus users.
- The involvement of the Octopus users in operational requests, projects as well as internal administration activities (meetings, training, etc.)
- If the Octopus users are properly filling out the Effort field of activities.
- If proper working methods are applied.
Adding the efforts in the activities provides a lot of information on the way the team functions, as well as some indicators of how some working methods can be improved.
For example, if one technician takes five hours to install a computer and another takes one, you could establish a process for this task, making sure everyone follows the same steps. This promotes internal training between Octopus users and ensures that the work gets done appropriately by all technicians.
In addition, the proper entry of the effort participates in the assessment of the cost of incidents or service requests as well as the average cost of support shown in the KPI reports for incidents or service requests, available in the Reports and Statistics modules.
Entering the effort in activities of the internal administrative requests requires the creation of an internal SR type. The contribution of the Octopus users will be reflected in more completely, as it will show the operational and the administrative activities.
More details
From the File > Reports and statistics or with the icon choose the Activity Timesheet report.

- Select one or more users.
- Check the options that you want from the following:
- Include activities with no effort specified (by default).
- Include the description of the activities (by default).
-
Include the description of the request.
- Include the department associated with the request.
- Include the category.
- Click on OK.
The generated report will detail the effort for each activity as well as the total of all efforts for the selected period.
It is possible to see a calendar view of Octopus users activities.
To find out how this option works, see the See the calendar of another assignee section of the Effort Management article.
Summary of activities - Total effort per site
This report will give you the summary of the total effort per site, based on selected time period. Only closed incidents/SR will appear. This will help you find out how much effort was dedicated to the support of each site.
The generated report shows:
- The selected period.
- The site name.
- The list of requests, containing:
- The request number, subject and description.
- The name of the person who resolved each request along with the resolution date.
- The total efforts for all request activities.
- The total sum of efforts by site, for the incidents, the SR and the sum for both (incident + SR efforts).
You can produce this report on a monthly basis to help you track sites that needed more assistance or made more requests to the IT department.
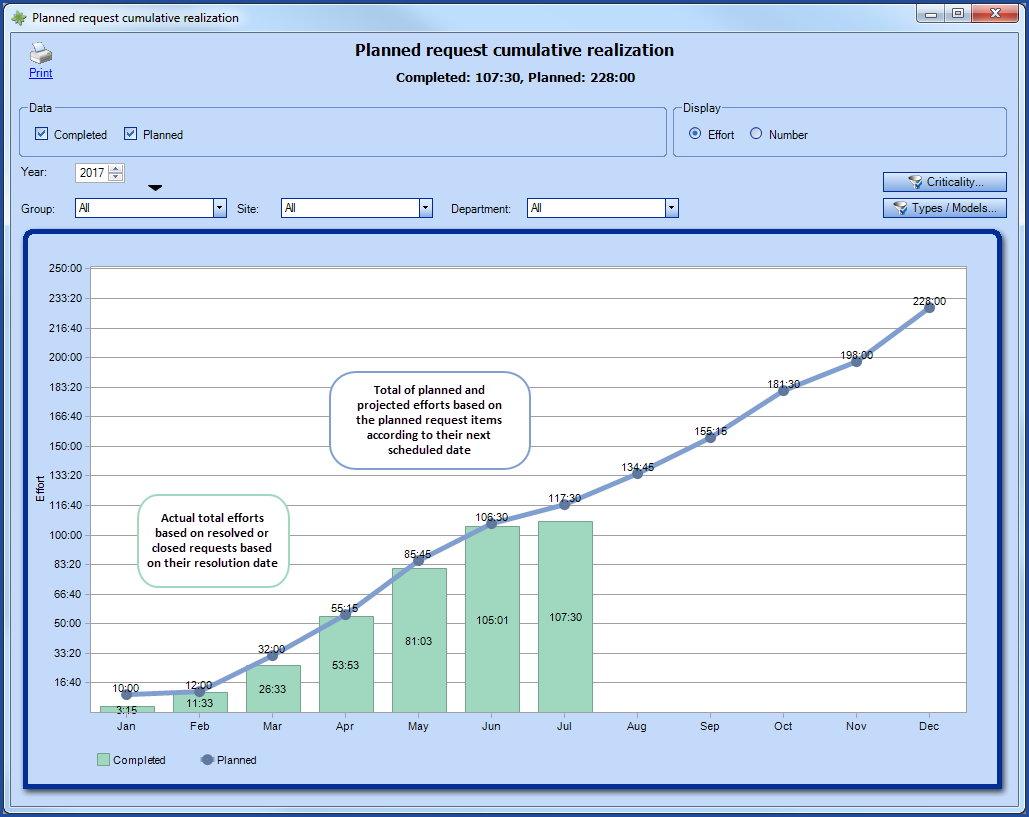
Planned request cumulative realization
The Planned request cumulative realization graph allows to compare by Effort; the actual effort in relation to the planned effort, or in terms of the Number of completed requests versus the number of planned ones.
For all the details on this report, see the Planned request cumulative realization section of the Planned Request Management Wiki.
Planned request cumulative realization - view by Effort
Planned request cumulative realization - view by Number
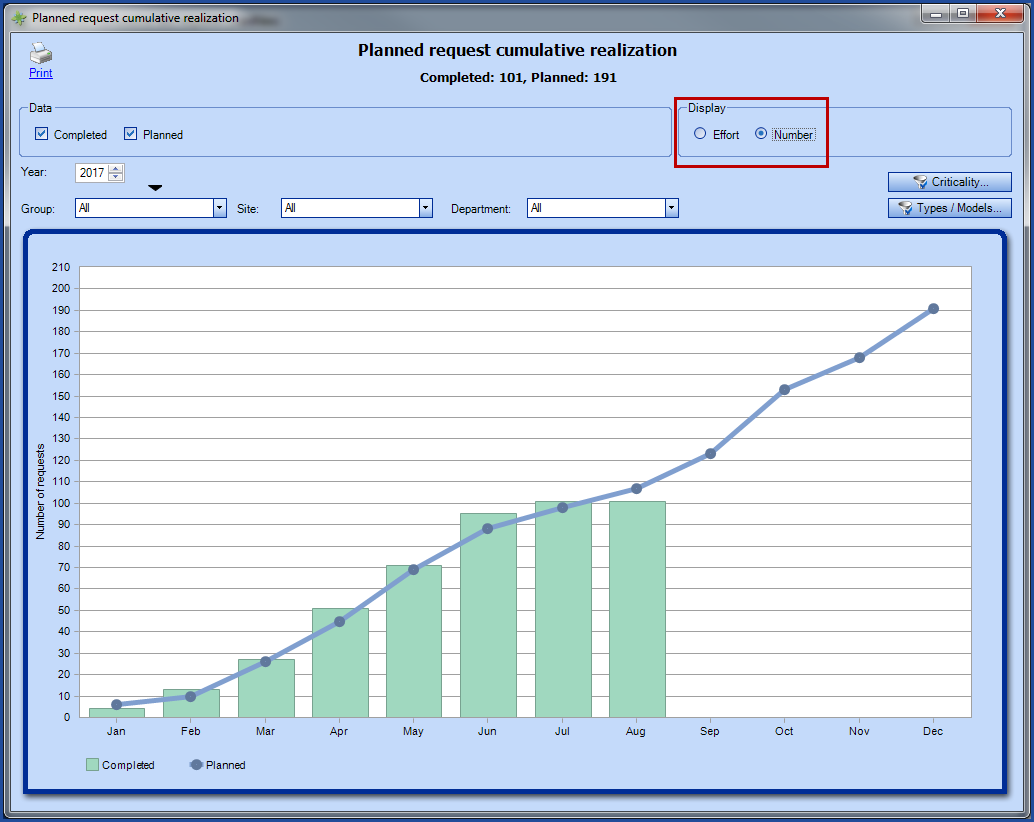
The graph can be opened in a side window if you use CTRL + the Planned request cumulative realization report.
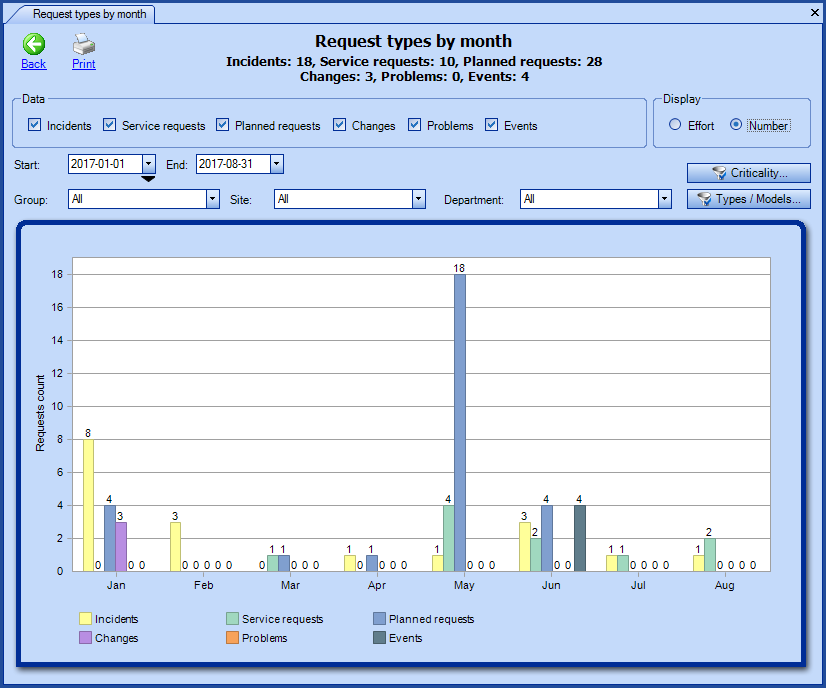
Request types by month
The Request types by month graph aims to help follow the work done by technicians in the form of the time spent on activities or the number of completed requests for better resource management.
Data and Display
The following types of requests can be selected in the report :
- Incidents
- Service requests
- Planned requests
- Changes
- Problems
- Events
The data will be shown according to the display type selected:
- Effort
- Based on the activities for the selected period.
- The effort must have been added in the activity in the time format hh:mm.
- Supplier efforts are excluded.
- If a filter has been applied on one of more groups, sites, departments or CI, only the activities of the corresponding requests will be shown.
- Number
-
Based on the activities for the selected period:
-
Incidents, service requests and planned requests that have been resolved.
-
Changes that were completed or closed.
-
Problems that were closed.
-
Events that were processed.
-
-
If a filter has been applied on one of more groups, sites, departments or CI, only the corresponding requests will be shown.
-
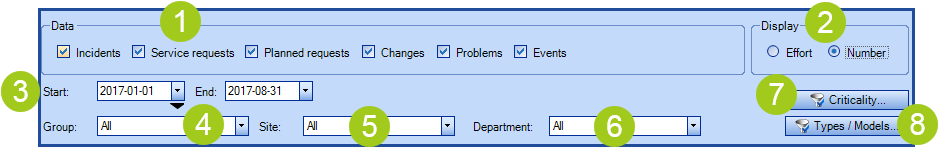
Filters
- Data: Shows one or more types of requests.
- Display: Data is displayed in the graph by the efforts entered in activities or by the number of completed requests for the selected period.
- Year: Represents a whole year.
- The little black arrow will allow the year to be modified to the start and end date.
- Group: Shows the effort distribution or the number of completed requests for a group.
- Site: Shows the effort distribution or the number of completed requests for a site or sub-site.
- Department: Shows the effort distribution or the number of completed requests for a department or sub-department.
- Criticality: Shows the effort distribution or the number of completed requests for one or more criticalities.
- Types / Models: Shows the effort distribution or the number of completed requests based on the CI types or models.
- The data from the requests without a CI will only be visible if all types and models are selected, which is the default option.

Graph contextual menu
Right-click inside a graph to access the context menu.
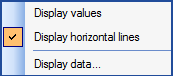
- Display values: Shows the data value at the top of each column.
-
Display horizontal lines: Allows to see or remove the horizontal lines in the graph.
-
This is the default option.
-
- Display data: To display the data related to a specific element, right-click on the column in the graph and select Display Data, the data will be shown in a list. It is also possible to double-click a column to drill into the data until you get a list.
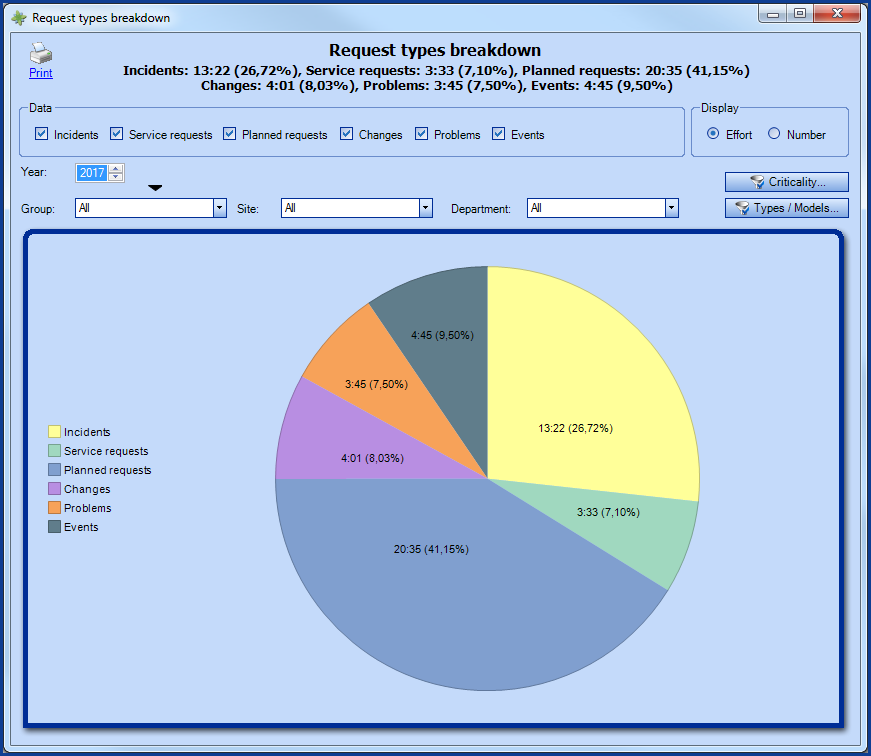
Request types breakdown
The Request types breakdown graph has as an objective to present, for a known period, the request distribution based on efforts or amount. This pie-chart diagram allows a global visibility and a comparison of work load distribution, based on request type. It is an add-on to the Request types per month graph and is based on the same display rules.
Data and Display
The following types of requests can be selected in the report :
- Incidents
- Service requests
- Planned requests
- Changes
- Problems
- Events
The data will be shown according to the display type selected:
- Effort
- Based on the activities for the selected period.
- The effort must have been added in the activity in the time format hh:mm.
- Supplier efforts are excluded.
- If a filter has been applied on one of more groups, sites, departments or CI, only the activities of the corresponding requests will be shown.
- Number
-
Based on the activities for the selected period:
-
Incidents, service requests and planned requests that have been resolved.
-
Changes that were completed or closed.
-
Problems that were closed.
-
Events that were processed.
-
-
If a filter has been applied on one of more groups, sites, departments or CI, only the corresponding requests will be shown.
-
Filters
- Data: Shows one or more types of requests.
- Display: Data is displayed in the graph by the efforts entered in activities or by the number of completed requests for the selected period.
- Year: Represents a whole year.
- The little black arrow will allow the year to be modified to the start and end date.
- Group: Shows the effort distribution or the number of completed requests for a group.
- Site: Shows the effort distribution or the number of completed requests for a site or sub-site.
- Department: Shows the effort distribution or the number of completed requests for a department or sub-department.
- Criticality: Shows the effort distribution or the number of completed requests for one or more criticalities.
- Types / Models: Shows the effort distribution or the number of completed requests based on the CI types or models.
- The data from the requests without a CI will only be visible if all types and models are selected, which is the default option.
Display data
It is possible to display the values related to a specific type by double clicking on its section or with a right click on the desired section, and selecting Display data from the contextual menu. When the graph is displaying Efforts, the result will be activities related to the types of requests for the selected period. If the graph is displaying Numbers, then the result will be the list of requests (based on the selected type).
Incident and service request KPIs
The reports for Incident KPIs and Service requests KPIs provide key performance indicators for incidents and service requests. The KPIs are available in the Statistics module.
When executing one of these reports, a window appears from which you can specify:
- The period covered by the report (Start & End).
- A report by site, department or group, identified according to the need.
This section presents the calculation details for each incident and service request KPI indicator. A note will explain, when required, if the indicator is specific to only one of the two KPI reports.
Basic Criteria Application
Certain basic criteria are applied to all the performance indicators in the report.- Is part of the current team.
- Is not a reservation request.
- Is not canceled.
According to the choice:

By Site
- Contains all site or is filtered according to selection.
By Department
- Contains all departments or is filtered according to selection.
By Group
- Contains all groups or is filtered according to selection and contains the Octopus users of the groups previously selected.
- The resolution group respects the group filter - for the indicators that refer to the resolution.
The others are represented in the following table.
| Indicator type | Application criteria |
| Total number of incidents/SR | |
| Number |
|
| Total number of incident/SR resolved | |
| Number |
|
| Total number of child incident/SR | |
|
Number |
|
| Incident/SR resolved within SLA targets | |
| Number |
|
| Percentage |
Number of incidents/SR resolved within the SLA. Total number of resolved incidents/SR. |
| Incidents/SR resolved without an on-site visit | |
| Number |
|
| Percentage |
Total number of incident/SR resolved without an on-site visit. Total number of incident/SR resolved. |
| Incidents/SR resolved by the service center | |
| Number |
|
| Percentage |
Total number of incident/SR resolved by the service center. Total number of incident/SR resolved. |
| Reopened Incidents/SR | |
| Number |
|
| Percentage |
Number of reopened incident/SR. Total number of incident/SR resolved. |
| Average support cost per incident | |
| Data source |
|
| Amount |
Sum of total efforts from the data source. Total number of incident/SR resolved. |
| Number of responses to the satisfaction survey | |
| Number |
|
| Percentage |
Number of responses to the satisfaction survey. Total number of incident/SR resolved. |
| Average level of user satisfaction | |
| Data source |
|
| Number |
Sum of the satisfaction levels. Number of responses to the survey. |
| Incidents/SR per priority | |
| Data source |
|
| Priority |
|
| Number |
|
| Percentage |
Total number of incidents/SR for the priority. Total number of opened incidents/SR. |
|
Incidents per category (incidents only) |
|
|
Data source |
|
| Category |
|
|
Number |
|
| Percentage |
Number of incidents for this category. Number of incidents for this category. |
| Total effort |
|
| Average effort |
Total sum of the efforts for incidents of this category. Total number of incidents for this category. |
|
Service request per type (SR only) |
|
| Data source |
|
| Types |
|
| Number |
|
| Percentage |
Number of SR for the type. Total number of opened SR. |
| Total effort |
|
| Average effort |
Total sum of the efforts in SR of this type. Total number of SR for this type. |
| Incidents/SR per source | |
| Data source |
|
| Sources |
|
| Number |
|
| Percentage |
Number of incidents/SR for this communication source. Total number of opened incidents/SR. |
| Incidents/SR per group (resolution) | |
|
Data source |
|
| Groups |
|
| Number |
|
| Percentage |
Number of incidents/SR for this resolution group. Total number of resolved incidents/SR. |
| Effort total |
|
| Incidents/SR per technician (resolution) | |
|
Data source |
|
| Technician |
|
| Number |
|
| Percentage |
Number of incidents/SR resolved by the associated technician. Total number of resolved incidents/SR |
| Total effort |
|
| Average delay before assignment taken (incidents only) | |
|
Data source |
|
| Average time (in bold) |
Sum of the response time for the incidents in the data source. Number of incidents present in the data source. |
| Priority |
|
| Average time |
Sum of the response time for the incidents in the data source Number of incidents present in the data source. |
| Average resolution time | |
| Data source |
|
| Average time (in bold) |
Sum of the Resolution delay (taking into account suspension) of the data source. Total number of resolved incidents/SR. |
| Priority |
|
| Average time |
Sum of the resolution delay of the data source for the associated priority. Number of incidents/SR present in the data source. |
| Incidents/SR resolved within targets | |
|
Data source |
|
| Priority |
|
| Number |
|
| Percentage |
Number of incidents/SR without a Late SLA status. Total number of incidents/SR for the associated priority. |
| Target |
|
CI Inventory
The CI Inventory report highlights information for the IT department. This information is in relation to the following three CI types: laptop, server, workstation.
The report can be selected By Site or By Department. The following information will be displayed, if it has been entered in the CI files:
- CI Type.
- CI Name.
- Model.
- CPU.
- Department.
- Local.
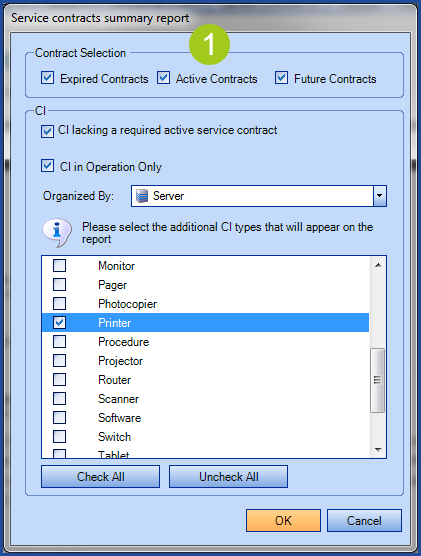
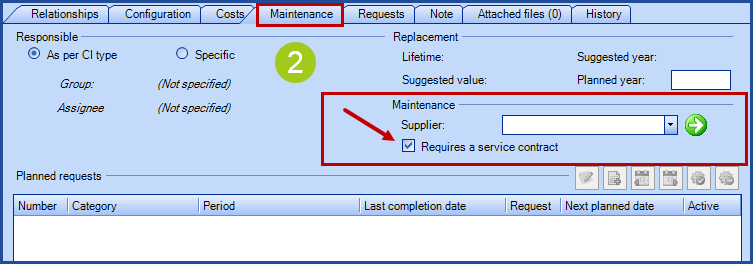
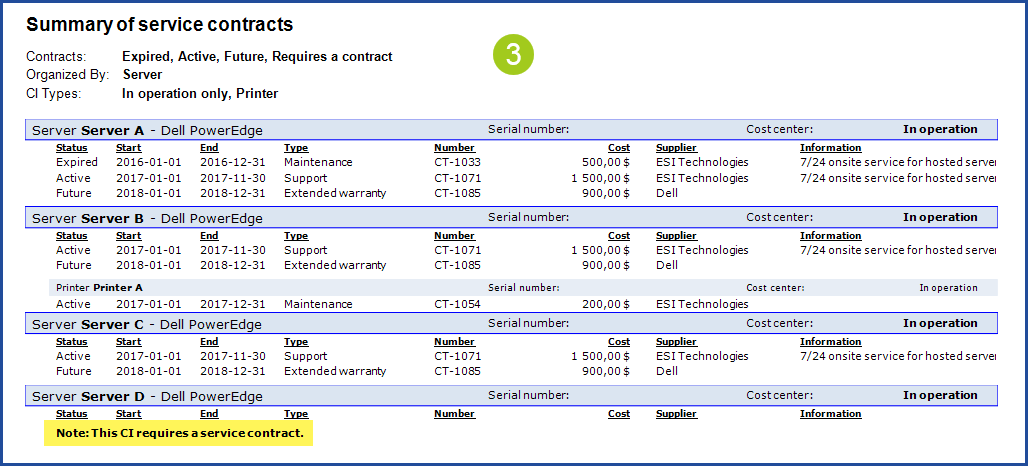
Service Contracts Summary Report
Reports can be created for service contracts based on different criteria. Select the appropriate combinations for the desired information.
- Expired, Active and Future contracts can be displayed. For example, search for all servers and printers service contracts.
- Indicate in the Maintenance tab which CI requires a service contract.
- In the results you will see the criteria used for the search and the information on the CI and contracts that correspond to what was searched for
The information returned on the contracts are:
- The status.
- The start date of the contract.
- The end date of the contract.
- The contact type.
- The contract number.
- The cost of the contact.
- The supplier.
- The description of the contract.
If you have the SQL knowledge, you can also exploit the data and make your custom reports with additional tools like Crystal Reports, Power BI. For hosted customers, you can automate the download of your database. See here for more details.
Thank you, your message has been sent.